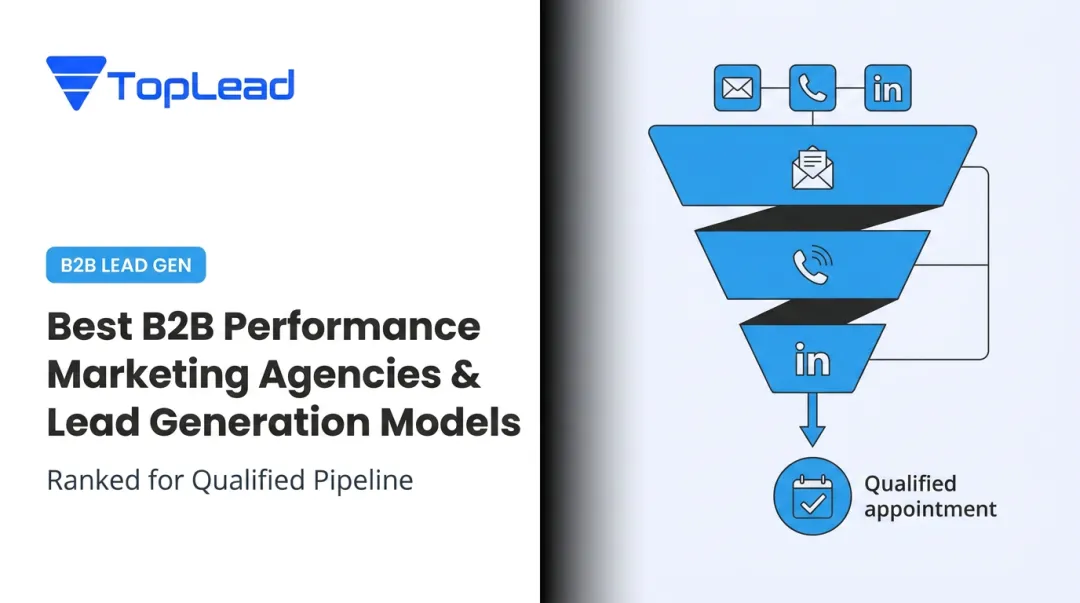
Introduction
Most mid-market tech companies are spending real money on lead generation — SDR teams, agency retainers, paid channels, LinkedIn outreach — and cannot tell you what it's returning.
That's not a measurement problem. It's a strategic visibility problem.
Enterprise companies have dedicated RevOps teams building attribution models. Small businesses run simple funnels with short cycles. Mid-market tech companies ($10M–$500M revenue) sit in the gap: complex enough for measurement to be hard, under-resourced for the systems to do it well.
The result is lead gen programs evaluated by MQL volume or cost-per-lead — metrics that feel like ROI but aren't.
If you're a sales or marketing leader at a B2B tech or SaaS company with an active lead gen program and no clear financial framework to evaluate it, this guide is for you. You'll find the ROI formula, current cost benchmarks, a channel-by-channel comparison, and a practical tracking system you can build without a dedicated RevOps team.
Key Takeaways
- ROI formula: (Revenue from closed leads − Total lead gen cost) ÷ Total lead gen cost × 100 — but most companies track the wrong inputs
- CPL benchmarks vary widely by channel; outbound cost-per-appointment for verified decision-maker meetings typically runs $300–$500
- Lead quality beats lead volume — high MQL counts with weak ICP targeting compress close rates and quietly inflate real CAC
- Channel concentration wins — teams with 1–3 marketers consistently outperform by focusing on 2–3 channels instead of spreading across 6–8
- Without source-to-revenue CRM attribution, you're measuring activity, not returns
Why Mid-Market Tech Companies Struggle to Measure Lead Gen ROI
The Structural Gap
Mid-market tech companies face a measurement problem that's structural, not just operational. Enterprise organizations invest in dedicated RevOps functions with multi-touch attribution models. Early-stage companies have simple enough funnels that measurement is almost automatic. Mid-market companies have deal complexity that demands sophisticated tracking, but rarely the team to build it.
The result: ROI gets measured by proxy. MQL volume, cost-per-lead, and activity reports substitute for pipeline dollars and closed revenue — metrics that produce false confidence. A team generating 200 MQLs per month at $80 CPL may look efficient on paper while generating almost no qualified pipeline.
According to Demand Gen Report's research on attribution maturity, only 36% of marketers have a measurable attribution strategy in place — yet 72% are now held responsible for revenue. That gap is where ROI measurement breaks down.
The Three Most Common Measurement Failures
1. Counting leads instead of pipeline MQLs measure marketing activity. Opportunities measure sales readiness. Optimizing for the former while being accountable for the latter creates systematic misalignment between what marketing reports and what sales actually delivers.
2. Underestimating fully-loaded costs Most teams count vendor invoices. Few account for SDR salaries, benefits, tools, CRM licenses, and management oversight. Omitting these inputs understates cost and overstates ROI — sometimes dramatically.
3. Losing revenue attribution at the source Without a source field that persists from lead creation through closed-won, there's no way to calculate what any channel actually returned. Teams measure spend but can't connect it to revenue.
Together, these gaps mean channel reallocation decisions are made on incomplete data — and the errors compound over time.
How to Calculate B2B Lead Generation ROI
The Core Formula
ROI = (Revenue Generated from Closed Leads − Total Cost of Lead Generation) ÷ Total Cost of Lead Generation × 100
The formula is straightforward. The inputs are not. You need:
- Revenue closed from a specific lead source
- Total cost of generating those leads
- A defined measurement window
Building the Fully-Loaded Cost Number
"Total cost" is where most calculations break down. The number should include:
- Agency or vendor fees (full invoice amount)
- Internal SDR/BDR salaries allocated to this program (prorated if split across programs)
- CRM, outreach, and data tools (proportional share)
- Management time spent overseeing the program (convert hours to dollar value)
Underestimating cost is how mid-market companies most often overstate ROI. An internal SDR program that looks like $60K/year often runs $90K–$110K when tools, benefits, ramp time, and management oversight are included.
The Conversion Chain: From CPL to Cost-Per-Closed-Deal
Cost-per-lead is just the entry point. Every conversion step multiplies cost. Here's how a $350 CPL can become a $3,500+ cost-per-closed-deal:
| Stage | Conversion Rate | Cost per Stage |
|---|---|---|
| Lead → Meeting | 30% | $1,167 per meeting |
| Meeting → Qualified Opportunity | 50% | $2,333 per opportunity |
| Opportunity → Closed Deal | 33% | $7,000 per closed deal |
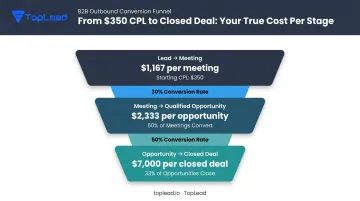
Per HubSpot's benchmarks, lead-to-customer conversion typically runs 2%–5%. At $350 CPL, that implies $7,000–$17,500 in lead cost per customer — before SDR labor, tools, or overhead. The takeaway: cost-per-opportunity (CPO) is a far more actionable metric than CPL for ROI purposes.
ACV, Sales Cycle Length, and ROI Timing
A $50K ACV deal with a 6-month cycle and a $150K ACV deal with a 9-month cycle can have identical lead generation costs — but produce completely different ROI timelines and effective returns. Per Apollo's 2024 outreach data, median private-company ACV was $26.3K with average sales cycles around 6.2 months.
That means a campaign started in January may not produce measurable closed revenue until July or later. Set your ROI measurement window to at least one full sales cycle. Measuring a 6-month program at the 60-day mark will systematically understate returns.
ROI vs. Pipeline ROI
- ROI (financial): Measures actual closed revenue. Definitive but delayed by sales cycle length.
- Pipeline ROI (forecasted): Measures pipeline value created, adjusted for historical win rate. Useful for in-period reporting as long as win rate assumptions come from actual data, not optimistic targets.
Use pipeline ROI for real-time reporting; use financial ROI for quarterly program reviews. Each serves a different decision-making horizon — the key is not mixing them in the same report.
Lead Generation Cost Benchmarks for Mid-Market Tech
Benchmarks matter because without them, you cannot tell whether a $300 CPL is efficient or expensive for your segment, channel, and deal size.
Cost-Per-Lead by Channel
WordStream's 2025 Google Ads benchmark report, based on 16,000+ campaigns, shows:
- Overall average CPL (paid search): $70.11
- Business Services CPL: $103.54
- Industrial and Commercial: $85.63
These are paid search figures. For outbound appointment setting in B2B tech, the range is considerably higher, reflecting stronger lead quality and decision-maker verification. Outsourced programs typically price verified meetings in the $300–$500 range.
TopLead's pay-per-appointment model averages $300–$350 per qualified appointment with decision-maker confirmation — a figure that compares favorably once you account for the fully-loaded cost of internal SDR programs.
Conversion Rate Benchmarks
Based on available B2B SaaS data:
- Lead-to-opportunity conversion: ~12% for SaaS companies (OpenView, via Gradient Works 2024)
- Qualified lead-to-opportunity: 15%–25% (HubSpot, broad B2B)
- Proposal-to-close: 25%–40% (HubSpot, broad B2B)
Mid-market tech companies with tightly defined ICPs tend to perform at the upper end of conversion benchmarks despite lower lead volumes. A 5-point improvement in close rate on a $350 CPL program with 20 leads/month translates to roughly one additional closed deal per quarter — which at $50K+ ACV can represent $200K+ in incremental annual revenue from a single efficiency gain.
The numbers above only matter if you know how to act on them. Use benchmarks as diagnostic tools, not optimization targets:
How to Use Benchmarks Correctly
- CPL well above benchmark → investigate data quality, channel fit, and ICP definition
- Conversion rate below benchmark → investigate ICP clarity, lead qualification criteria, and sales follow-up speed
- Cost-per-opportunity above benchmark → investigate where leads are stalling in the funnel and why
Which Lead Generation Channels Deliver the Best ROI for Mid-Market Tech
Channel Concentration Beats Channel Coverage
With 1–3 marketers — typical for mid-market tech — picking two to three channels and executing them with discipline consistently outperforms spreading effort across six to eight at low effectiveness. ROI is heavily influenced by concentration. Channel selection is the highest-leverage variable in your lead gen economics.
Outbound Channels: ROI Profile Comparison
Outbound appointment setting (outsourced SDR)
- Higher CPL ($300–$500+ per appointment), but high lead quality and a short path to pipeline
- Best ROI when ACV justifies the per-appointment cost — generally $50K+ contracts
- Naturally trackable: cost per appointment is fixed, and only verified decision-maker meetings count
- Companies selling $80K+ SaaS contracts to enterprise buyers should weight this channel heavily
Cold email
- Lower CPL, but highly variable quality
- ROI depends almost entirely on ICP precision and deliverability discipline
- Best fit for $15K–$30K contracts with shorter sales cycles, where volume compensates for lower per-lead conversion rates
LinkedIn outreach
- Lower volume but strong for senior decision-maker engagement
- LinkedIn's own data shows 89% of B2B marketers use LinkedIn for lead generation, with 62% reporting it generates leads
- Better ROI for complex, enterprise-adjacent deals where relationship-building precedes conversion
Inbound Channels: ROI Profile Comparison
Paid search (Google/LinkedIn Ads)
- Immediate pipeline but stops when spend stops
- High CPL in competitive tech categories ($100+ in Business Services)
- ROI degrades sharply if landing pages and qualification processes are weak
Content/SEO
- Lower CPL over time with compounding returns
- 3–6 month lag before meaningful traffic contribution
- Months 1–3: high effective CPL (all cost, minimal traffic). Months 12–18: CPL drops sharply as organic traffic scales without proportional cost increases
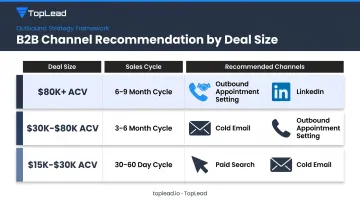
Channel Selection Framework
Match channel selection to deal economics and buyer behavior:
| Deal Size | Sales Cycle | Recommended Channel Weight |
|---|---|---|
| $80K+ ACV | 6–9 months | Outbound appointment setting + LinkedIn |
| $30K–$80K ACV | 3–6 months | Cold email + outbound appointment setting |
| $15K–$30K ACV | 30–60 days | Paid search + cold email |
The Multi-Touch Reality
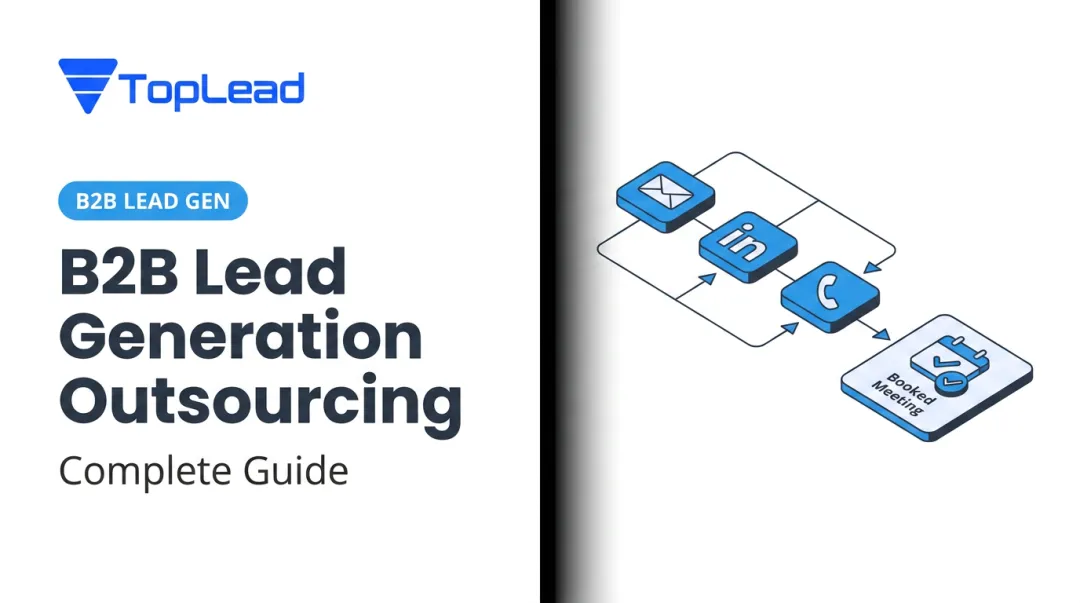
RAIN Group's research across 489 sellers and 488 buyers shows it takes an average of 8 touchpoints to get an initial meeting. Channels that reinforce each other — cold email + LinkedIn + phone — consistently outperform any single channel alone. TopLead, for instance, sequences email, LinkedIn, and phone across structured campaigns precisely because no single channel carries enough volume to hit that threshold alone.
The Biggest ROI Killers in Mid-Market B2B Lead Generation
ROI Killer #1 — Undefined ICP
When targeting criteria are vague — "mid-market tech companies" without specifying pain points, buying triggers, deal size fit, or disqualifying factors — campaigns generate volume but poor pipeline conversion.
A 10-point drop in close rate is almost always misread as a sales execution problem when it's actually a lead quality problem traceable to upstream targeting. The cost impact is real: if your team is closing 30% of opportunities and you drop to 20%, your cost-per-closed-deal rises by 50% from the same lead generation spend.
Tight ICP development is one of the highest-leverage ROI decisions you can make. TopLead's ICP development process, for instance, specifies the following before a single outreach message goes out:
- Firmographic criteria and deal size fit
- Buying triggers and disqualifying factors
- Technology stack requirements
- Decision-maker roles and authority levels
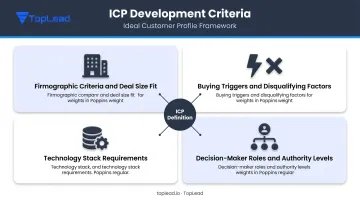
Each element is defined specifically to protect close rates downstream.
ROI Killer #2 — Measuring the Wrong Metrics
Companies that report to leadership using CPL as the primary metric will systematically make budget decisions that hurt ROI. CPL and cost-per-closed-deal can differ by 10x–20x depending on conversion rates. A $75 CPL from paid search that closes at 1% has a worse cost-per-customer than a $350 appointment fee that closes at 25%.
The fix: replace CPL as the primary reporting metric with cost-per-qualified-opportunity by source. This is the metric that most directly connects spend to revenue outcomes and creates aligned incentives between marketing and sales.
ROI Killer #3 — Slow Lead Follow-Up
Harvard Business Review's foundational research found firms that contacted online leads within 1 hour were nearly 7x as likely to qualify the lead as firms that waited longer. XANT's 2021 study of 5.7M marketing leads found that conversion rates are 8x higher when first contact occurs within 5 minutes — yet 57.1% of first-call attempts happen more than a week after lead creation.
Slow follow-up doesn't appear in CPL metrics, but it directly inflates cost-per-closed-deal by degrading conversion at every downstream stage. High-quality appointments from expensive lead generation programs lose real value when handoff to sales is slow.
How to Track and Improve Lead Gen ROI Going Forward
The Minimum Viable Tracking Stack
A mid-market tech company doesn't need a full RevOps infrastructure to track ROI properly. Three things are sufficient:
- UTM parameters on all inbound touchpoints — UTM source, medium, campaign, content, and term (HubSpot requires these for attribution reporting)
- CRM fields capturing lead source, lead creation date, and pathway to opportunity — these fields must persist through deal close, not just exist at lead creation
- A simple dashboard showing four metrics by source: cost, meetings generated, pipeline created, and closed revenue
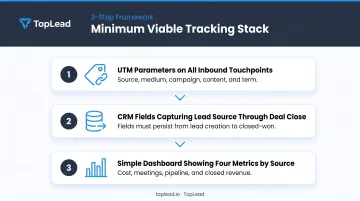
A well-configured CRM can have this setup running in 30–60 days. Without it, channel decisions are based on activity reporting, not return data.
The North Star Metric: Cost-Per-Qualified-Opportunity by Source
Replace cost-per-lead with cost-per-qualified-opportunity as your primary marketing-to-sales accountability metric. Here's how to calculate it:
Cost-Per-Qualified-Opportunity = Total Lead Gen Spend ÷ Number of Qualified Opportunities Created
This metric connects spend directly to sales-ready pipeline. It penalizes channels that generate volume without quality, and rewards channels — including outbound appointment setting — where lead qualification happens before the meeting.
Why Outsourced Appointment Setting Produces a Cleaner ROI
For mid-market tech companies without internal SDR capacity, outsourced pay-per-appointment models offer a structurally cleaner ROI calculation. The cost per appointment is fixed and transparent. Only verified decision-maker meetings count. There's no ramp time, no tool stack to stand up, and turnover risk sits with the provider — not you.
TopLead's model works as follows: clients pay $300–$350 per qualified appointment, with a reschedule or replacement guarantee if a prospect cancels. CRM integration covers Salesforce, HubSpot, Pipedrive, and others, so every appointment maps directly into pipeline tracking.
The internal sales team focuses entirely on closing rather than prospecting — which improves pipeline-to-spend ratios without adding headcount.
Tech companies using TopLead have reported a 40–60% increase in demo-to-close rates compared to cold outbound. Pre-qualification happens before the meeting reaches the calendar, so the sales team walks in with context — not cold introductions.
Frequently Asked Questions
What is the ROI of lead generation?
Lead generation ROI measures the revenue return relative to total investment: (Revenue from Closed Leads − Total Lead Gen Cost) ÷ Total Lead Gen Cost × 100. A positive ROI means the program is profitable; the threshold varies by ACV, sales cycle, and channel. For mid-market B2B tech, ROI should be measured over a full sales cycle — typically 6–9 months — not 30-day snapshots.
What is a good B2B lead conversion rate?
For B2B SaaS, lead-to-opportunity conversion averages around 12% (OpenView via Gradient Works, 2024), while qualified lead-to-opportunity rates run 15%–25% in broader B2B benchmarks. Opportunity-to-close typically falls in the 25%–40% range. Programs with tight ICP definitions consistently outperform volume-focused approaches on conversion rate.
How do you calculate cost per lead in B2B?
CPL = Total Lead Generation Spend ÷ Number of Leads Generated. The critical requirement: use fully-loaded cost in the numerator — agency fees, internal team time, tools, and CRM licenses. Vendor invoices alone understate cost significantly, which is the most common way B2B companies misstate their CPL and overstate their ROI.
What is a good cost per appointment for mid-market tech companies?
Outbound appointment setting with decision-maker verification typically runs $300–$500 per appointment. TopLead's pay-per-appointment model averages $300–$350 for verified decision-maker meetings. This compares favorably to fully-loaded internal SDR costs — SDR base salaries alone run $45K–$75K annually, before benefits, tools, ramp time, and management overhead.
How long does it take to see ROI from B2B lead generation?
Outbound and paid channels can generate pipeline in 30–60 days. Content and SEO channels take 3–6 months to contribute meaningfully. Full ROI measurement should align with your average sales cycle — measuring a 6–9 month cycle at the 60-day mark systematically understates returns, which is why TopLead's campaign lifecycle runs 3–6 months.
Should mid-market tech companies outsource lead generation or build in-house?
Outsourcing delivers faster time-to-pipeline, lower upfront cost, and a more predictable ROI structure — especially with pay-per-appointment models where you only pay for delivered meetings. In-house teams offer greater control and lower per-appointment cost at scale, but require management infrastructure, hiring capacity, and 90–180 days of ramp time — resources most mid-market teams don't have available at launch.